RSI vs MACD: Which Indicator Is Better for Crypto Trading?
- Anna Calvert
- September 5, 2026
- Guest Post
- 0 Comments
RSI and MACD are arguably two of the most popular technical indicators in crypto trading. Most people use them to read momentum, but each of them is used differently. The Relative Strength Index, or RSI, is all about the strength of the last price swings, and it’s meant to highlight possible overbought or oversold spots. While the Moving Average Convergence Divergence indicator, aka MACD, sort of lines up moving averages to judge trend direction and momentum, you know, like the push behind the move.
There really isn’t one clearly superior indicator – it depends. RSI can feel more useful for fast turnarounds, especially when the market is stuck in some tight range. At the same time, MACD might give you a cleaner sense of support when there’s already an active trend going. Many traders use both, but they still rely on real price action, support and resistance, volume, and strict risk management, because indicators alone are usually not enough.
Key Takeaways
- RSI reads how fast and how far price moved recently. MACD reads whether the moving averages are pulling apart or together. That’s the actual difference.
- RSI works when price is stuck in a range. MACD works when a trend is underway.
- If RSI shows overbought while MACD keeps rising, the move is stretched but still going.
- Set the stop-loss and position size before you act on either signal.
What Is RSI in Crypto Trading?
The Relative Strength Index is basically a tool for measuring the speed and size of recent price changes. It usually uses a 14-period setting, and many traders stick with that default.
Traders generally interpret:
- RSI above 70 can be read as possibly overbought
- RSI below 30 as potentially oversold
- RSI above 50 as more bullish momentum
- RSI below 50 as bearish momentum
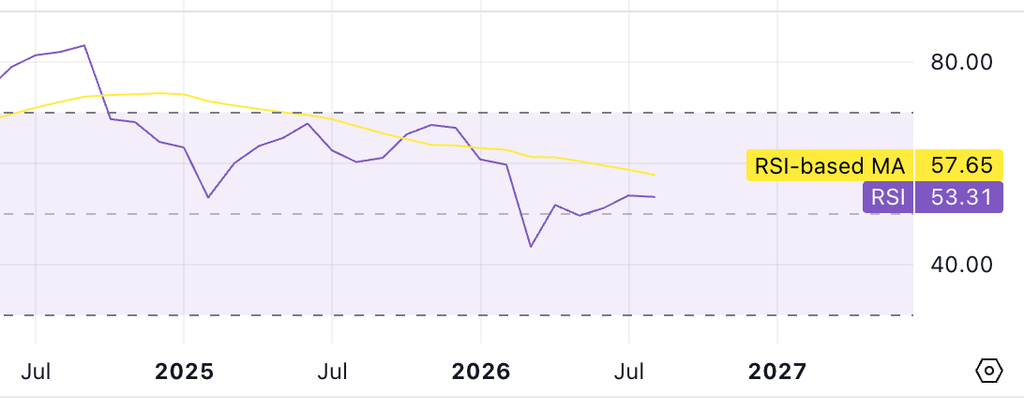
So if Bitcoin drops pretty hard and its RSI score slides under 30, traders may look for a bounce from support or at least a recovery attempt. But being oversold doesn’t mean the price must go up right away. RSI can often hang around below 30 during a serious, steady selloff. In the same vein, an asset can keep trading above 70 even while the uptrend still plays out, even if it feels stretched.
This RSI indicator guide basically lays out how traders interpret RSI readings and divergence across crypto markets.
What Is MACD in Crypto Trading?
MACD means Moving Average Convergence Divergence. The usual setup uses a 12-period EMA, a 26-period EMA, and a nine-period signal line.
A bullish crossover happens when the MACD line moves up past the signal line. A bearish crossover occurs when it dips below the signal line. When MACD is above zero, it may hint at positive momentum, while MACD below zero might signal bearish momentum.
Read this MACD indicator guide for a more detailed breakdown of what each part does.
Per Investopedia, MACD is centered on moving-average relationships, while RSI measures recent wins versus recent losses.
RSI vs MACD: Main Differences
| Feature | RSI | MACD |
| Main purpose | Identifies momentum extremes | Tracks trend direction and momentum |
| Scale | 0 to 100 | No fixed range |
| Common signals | Overbought, oversold and divergence | Crossovers, histogram changes and zero-line breaks |
| Best suited to | Range trading and short-term reversals | Trend confirmation and swing trading |
| Main limitation | Can remain extreme during strong trends | Can produce late signals |
RSI may be more useful when price moves sideways between support and resistance. MACD may work better during a sustained bullish or bearish trend.
The Altrady comparison of MACD and RSI discusses a similar distinction.
RSI vs MACD for Day and Swing Trading
For day traders, RSI is often used to catch quick pullbacks and fast momentum shifts. But a lower-timeframe RSI is generally just noise – it reacts quickly, and still ends up giving more false alarms than you’d expect.
On the other hand, looking at MACD tends to give you a wider trend picture. The crossovers and signal changes can come a little late, but that delay sometimes helps traders avoid overreacting to every tiny price wiggle.
Swing traders would want to lean on MACD first to map the broader direction of the market, then use RSI for that finer check, like whether a pullback is getting weaker, or if buyers are already reappearing. A bullish setup could look like:
- MACD staying above the zero line
- Price holding on to support
- RSI moving back up, toward 50 or even above it
- A bullish chart pattern that actually confirms the push
You can also see this idea mentioned in this guide to swing trading in cryptocurrency.
Still, before applying these indicators to futures or options, people should really understand the crypto derivatives risks. Crypto TradingView chart indicators can help you analyze setups on Delta Exchange India, but they do not magically remove leverage, liquidation risk, or volatility. Those risks stay there, even if your signals look clean.
How to Use RSI and MACD Together
- First, use MACD to spot the broader trend.
- Then use RSI to read short-term momentum.
- After that, check support, resistance, and the current price structure.
Only then, define your stop-loss and position size before entering; no shortcuts.
A bullish setup could include MACD above the signal line, RSI recovering back over 50, and price holding support without breaking. A bearish setup might be MACD below the signal line, RSI failing to reclaim 50, and price rejecting resistance, again and again.
The indicators might disagree too; RSI can mark overbought conditions while MACD still climbs, like it wants to keep going. That usually hints the move is pretty strong but also stretched, kinda “pushed” out already. In that case, some traders wait for a support break, a bearish divergence, or even a MACD crossover before they change their view.
Gold Futures, RWA, and Broader Market Context
Technical crypto indicators measure how price behaves. They don’t directly tell you the fundamentals behind each asset.
People trading tokenized commodities might look at gold futures (XAUT) and digital gold derivatives. Those markets can react to interest rates, currency shifts, and the overall risk mood.
Real-world assets, or RWAs, are another growing topic. The infrastructure side of RWA yield is about how treasuries, commodities, and private credit are being wired into decentralized finance.
RSI and MACD can help you study momentum here, but liquidity, the product structure, and the fundamental risk still need their own separate thinking.
The Bottom Line
RSI is often more useful for spotting overbought or oversold states, for short-term turns, and for markets that stay in a range.
MACD is usually better when you want to judge trend direction and momentum continuation.
A practical approach is to use MACD for trend context, RSI for momentum, and let price action confirm. Still, neither indicator should be treated as a standalone trading system or as a sure thing for profit.
FAQs
1. For crypto trading, which is better, RSI or MACD?
RSI is often better for finding overbought and oversold areas while MACD is usually more useful when you want to analyze trend direction and momentum. Many traders also combine the two.
2. Can we use RSI and MACD together?
Yes, they can be paired up. People often use MACD to capture the broader trend, RSI to gauge near-term momentum, and price action to confirm a possible entry or exit, kinda like not just guessing.
3. Which indicator is better for crypto day trading?
RSI gives you quicker signals for short-term trades, while MACD provides you more context for the trend. If you use both, it can help you to rely less on a single indicator.